
购物中心商户的租金坪效问题?
——图片来自网络
谢邀。
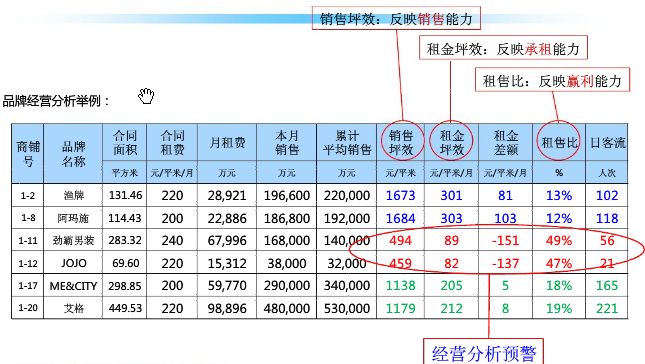
坪效是台湾经常拿来计算商场经营效益的指标, 指的是每坪的面积可以产出多少营业额(营业额÷专柜所占总坪数)。
坪效:通俗说为单平方效益
坪效=销售额/面积(取某一个时间段)
注意:个别业态特殊,如服装有淡旺季,所以才有以平均销售额/面积的公司,以降低错误率
如,劲霸坪效:140000/283.32=494.14
租金坪效,了解不是很多,大体上是现行百货及合作模式中“纯租金OR扣点”或者“租金+扣点”的一种算法。
租金坪效=销售额*扣点/面积=销售坪效*扣点
由图可得扣点约为:18%
如,劲霸租金坪效:140000*18%/283.32=89
得出租金差额=89-240=-151(反映出该商铺经营状况很差,其租金成本远远高出其承受能力)
意思为:以扣点形式收取租金将会比纯租金形式收取少收取:151元/平方/月
同时,意思为,假设以240元/平方/月租金收益为目标,劲霸男装的销售指标应为:
240*283.32/18%=377756,才能收取预期租金
租售比=租金/营业额*100%(其实这种称呼仅限百货和商业体,台湾人一般称为营租比,和商业地产商铺的租售比(租金/售价=回报率)区分。
如有错误,欢迎揪出。
1、坪效=销售额/租赁面积
2、坪效是商场业主方衡量经营状况的最重要的指标,我认为没有之一。一个商场人气再旺、品牌再光鲜,如果坪效上不去,不好意思,也就是这块地没有产生实际的收入,从财务上来说还是失败的。
3、坪效达到多少是合理的?
不同城市,标准不同。
一线城市如上海,据我所了解的业内人士的反映,2015年的大致标准是,周坪效200元以上(注意是周坪效,不是月,因为全年各月有淡旺,周比月更便于横向比较),算稳住脚跟的商场,400以上,是经营比较好的,没有上限,据说浦东嘉里城达到了700左右,属于业内标杆了。
二三线省会城市,就我所了解的,比如万达体系内全国销售排名前五的某广场,2015年总销售近20个亿,租赁面积10万㎡,粗算一下月坪效在1500-2000元之间。
坪效=销售额/面积
专门写了一篇各个行业坪效对比的文章,可参考:
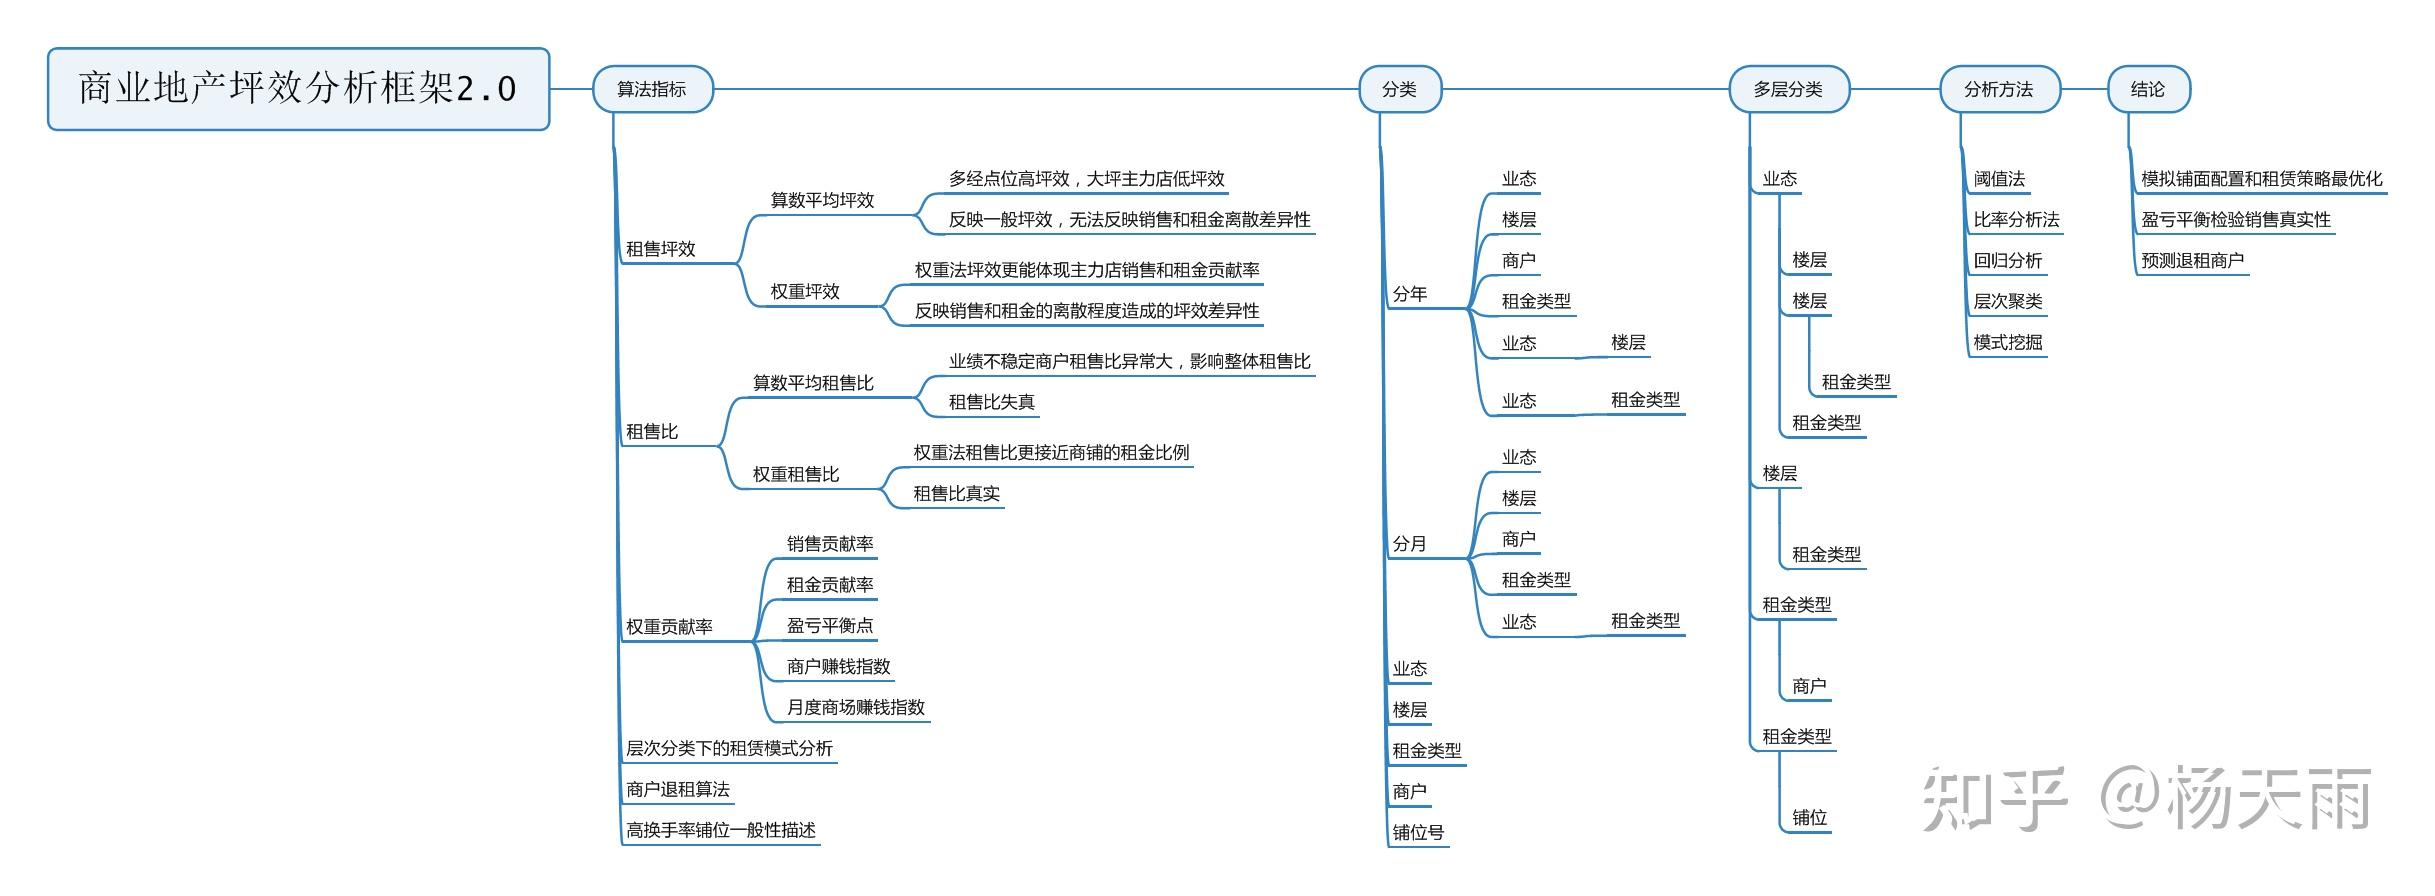
第二版分析框架,在进一步深入理解业务数据,掌握新的分析方法,开发出算法后形成的分析框架,细节上有更多的细化和更新。
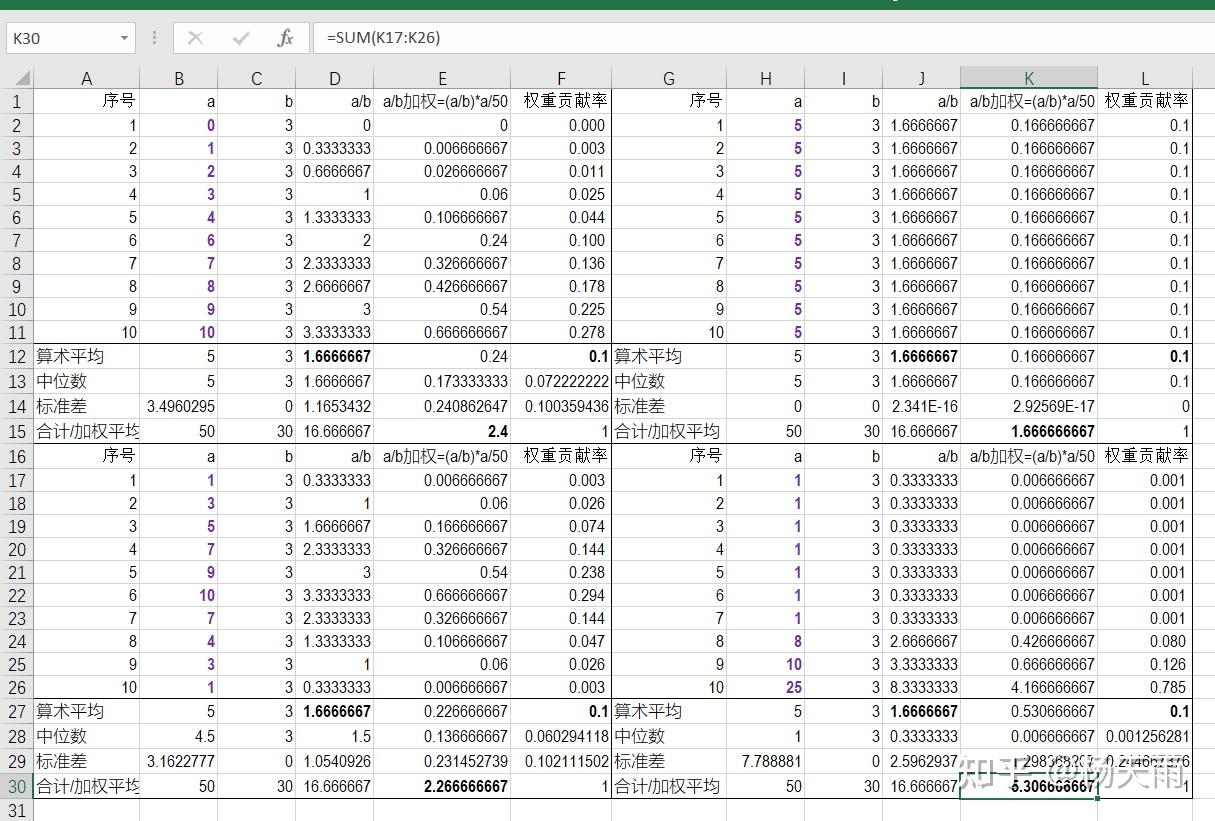
一直以来有一个困扰,一组数据用均值(或者中值或众数)代表整体水平是否可靠?如图展示一个例子,直观说明算术平均(均值)是一个平庸的指标。算术平均值不受整体离散程度的影响,只和汇总数和数据个数有关,而加权平均数据越离散值越大,体现离散差异,权重越大代表贡献率就大,能反映由权重支配的整体数据。 的算术平均是一个平庸的指标,与数据的离散程度无关,不能代表
的整体水平,始终等于1.667。而
权重法比均值更好的反映离散差异,能代表
的整体水平。
销售坪效sale efficiency= ;
sale / area as sale_ping,
租金坪效rent efficiency= ;
rent / area as rent_ping,
租售比rent&sale ratio= ;
rent / sale as ratio,
整体销售total sale= ,
个月里
个商户的销售汇总;
sum(sale) as s_m_sale,
整体租金total rents= ,
个月里
个商户的租金汇总;
sum(rent) as s_m_rent,
商户月销售加权坪效
weighted sale efficiency==
;
(sale / area) * (sale / s_m_sale) as weighted_sale_ping,
商户月租金加权坪效
weighted rent efficiency==
;
(rent / area) * (rent / s_m_rent) as weighted_rent_ping,
分类销售加权坪效
multi-field categorical weighted sale efficiency==
;
sum((sale / area) * (sale / s_sale)) as category_weighted_sale_ping, -- sql不允许sum((sale / area) * (sale / sum(sale)))嵌套聚合函数,必要做表的拼接
分类租金加权坪效
multi-field categorical weighted rent efficiency==
;
sum((rent / area) * (rent / s_rent)) as category_weighted_rent_ping,
整体销售权重坪效
whole weighted average sale efficiency= ,
:
月商户
的销售,
:商户
租赁的商铺面积,
: 月数,
:
月商户数;
sum((sale / area) * (sale / s_m_sale)) as a_weighted_sale_ping,
整体租金权重坪效
whole weighted average rent efficiency= ,
:
月商户
的租金,
:商户
租赁的商铺面积,
: 月数,
:
月商户数;
sum((rent / area) * (rent / s_m_rent)) as a_weighted_rent_ping,
月销售加权贡献率
weighted sale contribution ratio==
;
((sale / area) * (sale / s_m_sale)) / a_weighted_sale_ping as weighted_sale_contribution_ratio,
月租金加权贡献率
weighted rent contribution ratio==
;
((rent / area) * (rent / s_m_rent)) / a_weighted_rent_ping as weighted_rent_contribution_ratio,
多重分类销售贡献率汇总
whole multi-field categorical sale contribution ratio= ;
sum(weighted_sale_contribution_ratio) as whole_weighted_sale_contribution_ratio,
多重分类租金贡献率汇总
whole multi-field categorical rent contribution ratio= ,c-1个分类分组下的贡献率汇总,合计为分类数量或者几个分类数的乘积,表示不分类或以某个类或者多重类下m个月里n个商户的销售贡献率分类汇总,比如以月分类汇总历月贡献率,以年分类汇总历年度贡献率;
sum(weighted_rent_contribution_ratio) as whole_weighted_rent_contribution_ratio,
多重分类销售贡献率
multi-field categorical sale contribution ratio= ;
sum(weighted_sale_contribution_ratio / whole_weighted_sale_contribution_ratio) as sale_contribution_ratio,
多重分类销售贡献率
multi-field categorical rent contribution ratio= ,分类数比汇总分类多1层;
sum(weighted_rent_contribution_ratio / whole_weighted_rent_contribution_ratio) as rent_contribution_ratio,
多重分类权重租售比
multi-field categorical weighted average rent&sale ratio==
,
:
分类下
月
商户的租金。
:
分类下
月
商户的销售。
分类数量。e.g比如按年1个分类的租售比,按年业态2个分类的租售比,按年业态楼层收租方式4个分类的租售比;
sum(ratio * rent / s_rent) as category_weighted_ratio,
坪效租售比
multi-field categorical weighted efficiency ratio= ;
sum((rent / area) * (rent / s_rent)) / sum((sale / area) * (sale / s_sale)) as ping_ratio,
盈亏平衡点 break even point
= ;
sale_contribution_ratio - rent_contribution_ratio * category_weighted_ratio as '盈亏平衡点', -- as break_even_point
赚钱指数 money index
=
(sale_contribution_ratio - rent_contribution_ratio * category_weighted_ratio) * 10000 as money_index, -- as '赚钱指数',
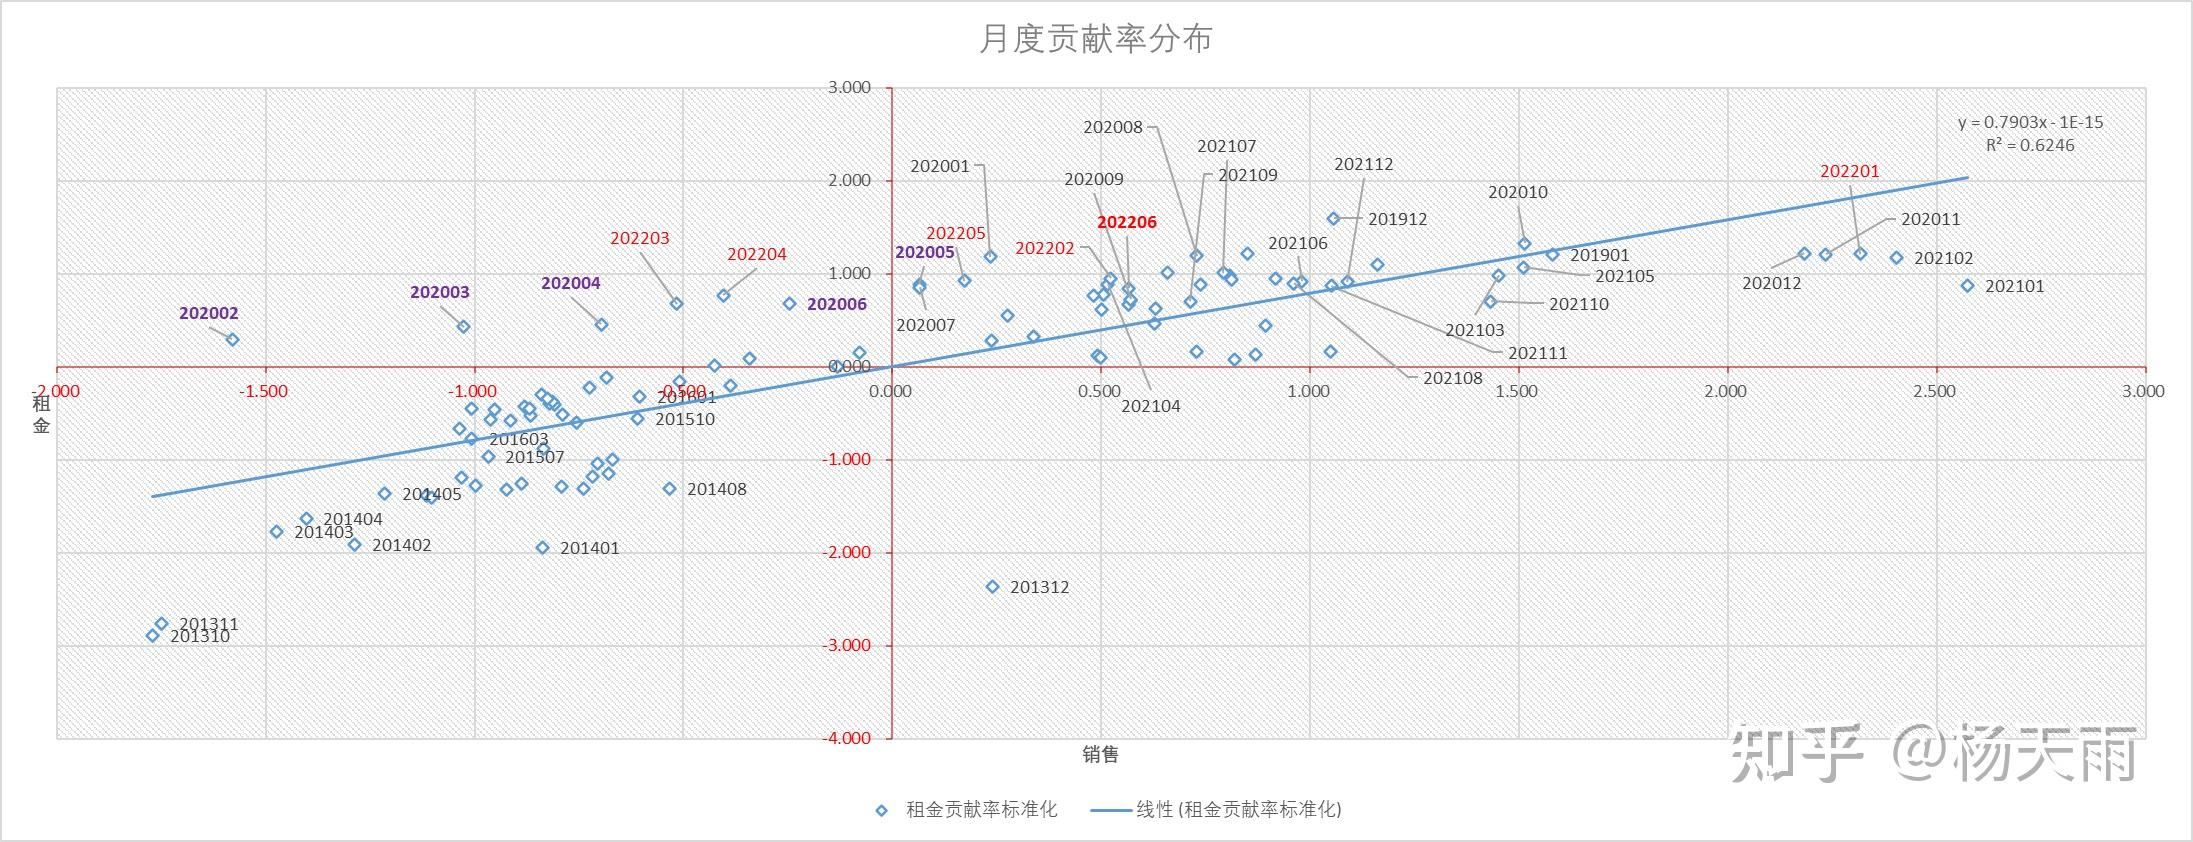
设销售贡献率y、租金贡献率x和赚钱指数i,赚钱指数i是租售比b和两贡献率x和y与常数C的线性关系:
i= ,盈亏平衡点c=
;
y= ,得 y 和 x是以
为截距,租售比
为斜率的一元线性方程,类似资本资产定价模型CAPM。
当不亏不盈时, =0,得租售比
,与加权租售比一致;
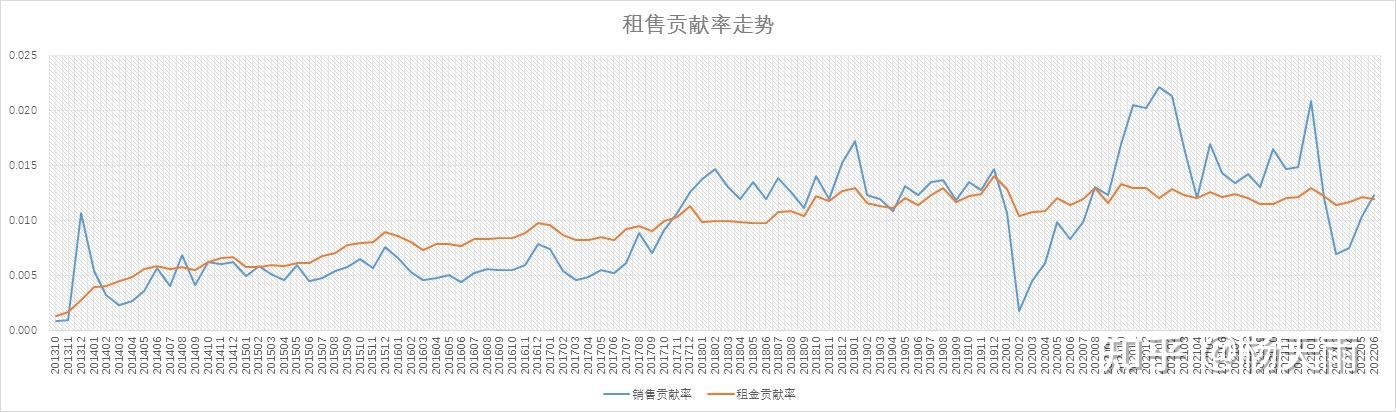
c在2020年2月和3月为负值,b跌落历史性低谷,而实际租售比处于历史性高峰,各购物中心纷纷降租减租与租户共渡难关,可以说减租幅度是史无前例的。
理想的销售贡献率走势始终要走在租金贡献率的上方,走下方偏离幅度不能超过租售比。如果半年以上大幅跌落到租金贡献率的下方,会造成微观租户亏钱退租退场,中观购物中心倒闭,宏观商业环境大萧条。
字段计算,属性分组,多层次分类,多重嵌套查询,可挖掘租赁模式、购物中心赚钱指数等信息。模式匹配的假设是过往经验可以复制和延续,模式挖掘思路大体1层分类(业态、楼层、收租方式)下匹配最赚钱和最亏钱的模式;2级分类(业态+楼层、业态+收租方式、楼层+收租方式)下匹配最赚钱和最亏钱的模式;3级分类(业态+楼层+收租方式)下匹配最赚钱和最亏钱的模式;
结论就是得到什么业态在什么楼层配置什么收租方式下的赚钱或亏钱模式,数据背后是拿真金白银开店的商户商业实践,一大部分是试错亏钱的商户。
任何模式都是环境当中的产物,经历过疫情反复,不能过度迷信以往模式和经验而遗忘疫情的系统性冲击和经济个体深处其中的努力和挣扎。
不同城市、同一城市不同购物中心商业文化资源培育程度各异,赚钱指数各有千秋。在缺乏数据下的直观感受,上海的坪效肯定高于昆明的坪效;同为昆明北市区购物中心,同德广场的坪效可能高于欣都龙城的坪效。
有数据,掌握分析方法,你才能理解不一样的商业。
-- 加权算法
-- 多重分类销售和租金坪效和贡献率
-- create table vcpark.category_ping
-- insert into vcpark.category_ping
select
	-- year,
	-- month,
	-- indy,
	-- floorid,
	rent_type, -- as '收租方式',
	-- shopid,
	-- shop,
	-- position,
	-- if(shopid not in (select distinct shopid from vcpark.sale where month=202206) and shop !='H&M','否','是') as '在租',
	sale_million100 as '销售[亿]',
	rent_million100 as '租金[亿]',
	cnt as '数量',
	loss_quit as '亏损数',
	loss_quit_rate, -- as '亏损数占比',
	-- dc_rent_type as '计租类型变更数',
	-- turnover_rate as '换手次数',
	category_weighted_sale_ping, -- as '销售坪效',
	category_weighted_rent_ping, -- as '租金坪效',
	(sale_contribution_ratio - rent_contribution_ratio * category_weighted_ratio) * 10000  as money_index, -- as '商户赚钱指数',
	sale_contribution_ratio - rent_contribution_ratio * category_weighted_ratio as break_even_point, -- as '盈亏平衡点',
	sale_contribution_ratio, -- as '销售贡献率',
	rent_contribution_ratio, -- as '租金贡献率',
	ping_ratio as '坪效租售比',
	category_weighted_ratio -- as '租售比'
from
(
	select year,month,indy,floorid,rent_type,shopid,shop,position,
		sum(sale) / 100000000 as sale_million100,
		sum(rent) / 100000000 as rent_million100,
		count(*) as cnt,
		-- 销售贡献率 - 租金贡献率 * 租售比小于0为退租充分条件
		count(if(m_break_even_point < 0,1,null)) as loss_quit, -- as '亏损数',
		-- 大于0.7有退租可能为必要条件
		count(if(m_break_even_point < 0,1,null)) / count(*) as loss_quit_rate,
		count(distinct rent_type) as dc_rent_type,
		count(distinct shop) as turnover_rate,
		sum((sale / area) * (sale / s_sale)) as category_weighted_sale_ping,
		sum((rent / area) * (rent / s_rent)) as category_weighted_rent_ping,
		sum(weighted_sale_contribution_ratio / whole_weighted_sale_contribution_ratio)  as sale_contribution_ratio,
		sum(weighted_rent_contribution_ratio / whole_weighted_rent_contribution_ratio)  as rent_contribution_ratio,
		sum((rent / area) * (rent / s_rent)) / sum((sale / area) * (sale / s_sale)) as ping_ratio,
		sum(ratio * rent / s_rent) as category_weighted_ratio
	from
	(
		select s.*,s_sale,s_rent,whole_weighted_sale_contribution_ratio,whole_weighted_rent_contribution_ratio
		from
		(
			(
				select *,
					weighted_sale_contribution_ratio - weighted_rent_contribution_ratio * ratio  as m_break_even_point
				from vcpark.ping
				order by month
			) as s,
			(
				select category_group_left_table.*,
					whole_weighted_sale_contribution_ratio,
					whole_weighted_rent_contribution_ratio
				from
				(
					(
						select year as y,month as m,indy as dy,floorid as fid,rent_type as rt,position as p,shopid as id,
							sum(sale) as s_sale,
							sum(rent) as s_rent
						from vcpark.ping
						-- group by year
						-- group by year,indy
						-- group by year,floorid
						-- group by year,rent_type
						-- group by year,shopid
						-- group by month
						-- group by month,indy
						-- group by month,indy,rent_type
						-- group by month,floorid
						-- group by indy
						-- group by indy,floorid
						-- group by floorid
						group by rent_type
						-- group by position
						-- group by indy,rent_type
						-- group by floorid,rent_type
						-- group by indy,floorid,rent_type
						-- group by rent_type,shopid
						-- group by indy,rent_type,position
						-- group by indy,floorid,shopid
						-- group by shopid
					) as category_group_left_table,
					(
						select year as yy,month as mm,indy as ddy,floorid as ffid,rent_type as rrt,position as pp,shopid as iid,
							sum(weighted_sale_contribution_ratio) as whole_weighted_sale_contribution_ratio,
							sum(weighted_rent_contribution_ratio) as whole_weighted_rent_contribution_ratio
						from vcpark.ping
						-- 少1层分类
						-- 2层分类
						-- group by year
						-- 3层分类
						-- group by year,indy
						-- group by year,floorid
						-- group by year,rent_type
						-- group by month
						-- group by month,indy
						-- group by month,floorid
						-- group by indy
						-- group by floorid
						-- group by indy,floorid
						-- group by rent_type
						-- group by indy,floorid,rent_type
						-- group by indy,rent_type
					) as category_group_right_table
				)
				-- where y=yy
				-- where y=yy and dy=ddy
				-- where y=yy and fid=ffid
				-- where y=yy and rt=rrt
				-- where m=mm
				-- where id=iid
				-- where m=mm and dy=ddy
				-- where m=mm and fid=ffid
				-- where dy=ddy
				-- where fid=ffid
				-- where rt=rrt
				-- where dy=ddy and fid=ffid
				-- where dy=ddy and fid=ffid and rt=rrt
				-- where dy=ddy and rt=rrt
			)as category_group_table  -- 外层条件合并
		)
		-- where year=y
		-- where year=y and indy=dy
		-- where year=y and floorid=fid
		-- where year=y and rent_type=rt
		-- where year=y and shopid=id
		-- where month=m
		-- where shopid=id
		-- where month=m and indy=dy
		-- where month=m and indy=dy and rent_type=rt
		-- where month=m and floorid=fid
		-- where indy=dy
		-- where floorid=fid
		where rent_type=rt
		-- where rent_type=rt and shopid=id
		-- where position=p
		-- where indy=dy and floorid=fid
		-- where indy=dy and rent_type=rt
		-- where floorid=fid and rent_type=rt
		-- where indy=dy and floorid=fid and rent_type=rt
		-- where indy=dy and rent_type=rt and `position`=p
		-- where indy=dy and floorid=fid and shopid=id
	)as outer_category_group_table
	-- group by year
	-- group by month
	-- group by indy
	-- group by floorid
	group by rent_type
	-- group by position
	-- group by shopid
	-- group by year,shopid
	-- group by year,indy
	-- group by year,indy,rent_type
	-- group by year,indy,shopid
	-- group by year,floorid
	-- group by year,floorid,rent_type
	-- group by year,rent_type
	-- group by year,rent_type,shopid
	-- group by month,indy
	-- group by month,indy,rent_type
	-- group by month,floorid
	-- group by month,floorid,rent_type
	-- group by month,rent_type
	-- group by indy,floorid
	-- group by indy,floorid,shopid
	-- group by indy,rent_type
	-- group by floorid,rent_type
	-- group by indy,floorid,rent_type
	-- group by indy,rent_type,position
	-- group by rent_type,shopid
	-- group by indy,floorid,shopid
	-- group by indy,floorid,rent_type,shopid
)as whole_combination_table
-- where rent_type='纯扣点' -- shop like '%漫咖啡%' or shop like '%星巴克%' -- indy='CY' -- and shop like '%鼻祖%' -- loss_quit_rate >=0.7 -- and indy='FW' -- and -- floorid=0 and  -- position like '%3-011/012%' -- shopid='0348' or shopid='0356' indy='LS' -- and shopid in (select distinct shopid from vcpark.sale where month=202206)
-- order by year;
-- order by month;
-- order by indy;
-- order by floorid;
order by rent_type;
-- order by turnover_rate desc;
-- order by money_index desc;
-- order by year,money_index desc;
-- order by year,indy;
-- order by year,indy,rent_type;
-- order by year,indy,money_index desc;
-- order by year,floorid;
-- order by year,floorid,rent_type;
-- order by year,rent_type;
-- order by year,rent_type,money_index desc;
-- order by year,money_index desc;
-- order by month,indy;
-- order by month,indy,rent_type;
-- order by indy,rent_type,month;
-- order by month,floorid;
-- order by month,floorid,rent_type;
-- order by month,rent_type;
-- order by indy,floorid;
-- order by indy,floorid,money_index desc;
-- order by indy,rent_type;
-- order by floorid,rent_type;
-- order by indy,floorid,rent_type;
-- order by rent_type,money_index desc;
-- order by money_index desc,indy,rent_type;
-- order by indy,floorid,rent_type,money_index desc;
以盈亏平衡点阈值0衡量租户赚钱和亏钱,可检验商户销售的真实性,针对那些表面长期亏钱依然不退租的商户采取运营措施优化商业坪效和价值。
- 非加权退租算法
-- 与加权算法有差异
select
	-- month,
	shop,
	rent_type as '计租方式',
	-- off as '退租状态',
	-- count(distinct rent_type) as '计租类型数',
	sum(diff_index) as money_index,
	count(month) as '租赁数',
	-- 销售贡献率 - 租金贡献率 * 租售比小于0为退租判断条件
	count(if(diff_index < 0,1,null)) as '亏损数',
	-- 大于0.7有退租可能
	count(if(diff_index < 0,1,null)) / count(month) as lost -- as '亏损数占比'
from
(
	select month,
		shop,
		indy,
		floorid,
		area,
		rent_type,
		sale,
		rent,
		-- weighted_sale_ping,
		-- weighted_rent_ping,
		ratio,
		-- (销售贡献率 - 租金贡献率 * 租售比) * record_count
		(weighted_sale_contribution_ratio - weighted_rent_contribution_ratio * ratio) * 1000 as BEP
		-- if(shopid not in (select distinct shopid from vcpark.sale where month=202206) and shop !='H&M',1,0) as off
	from vcpark.ping
	where shop = '%%' -- indy='CY' and rent_type='纯扣点' -- -- shopid not in (select distinct shopid from vcpark.sale where year=2022) -- and shop like '%%' --
	order by shop,month
)as s
group by shop
-- group by month
order by money_index desc,shop;
-- order by month;
常用的标准化z-score,产生和值及均值为0,标准差为1的一组数据。STZ= ;
对月分类的租售贡献率做标准化后的回归分析
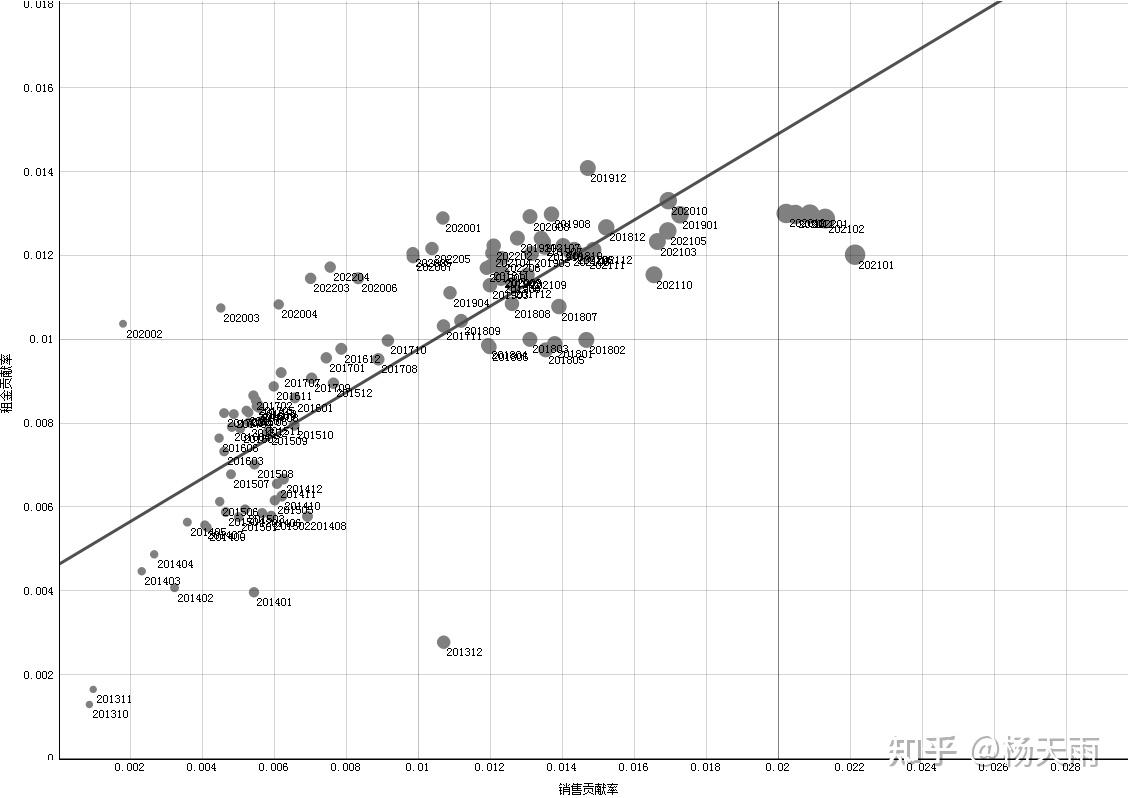
未标准化的贡献率分布,图标颗粒大小代表销售贡献率大小。检验贡献率算法的有效性
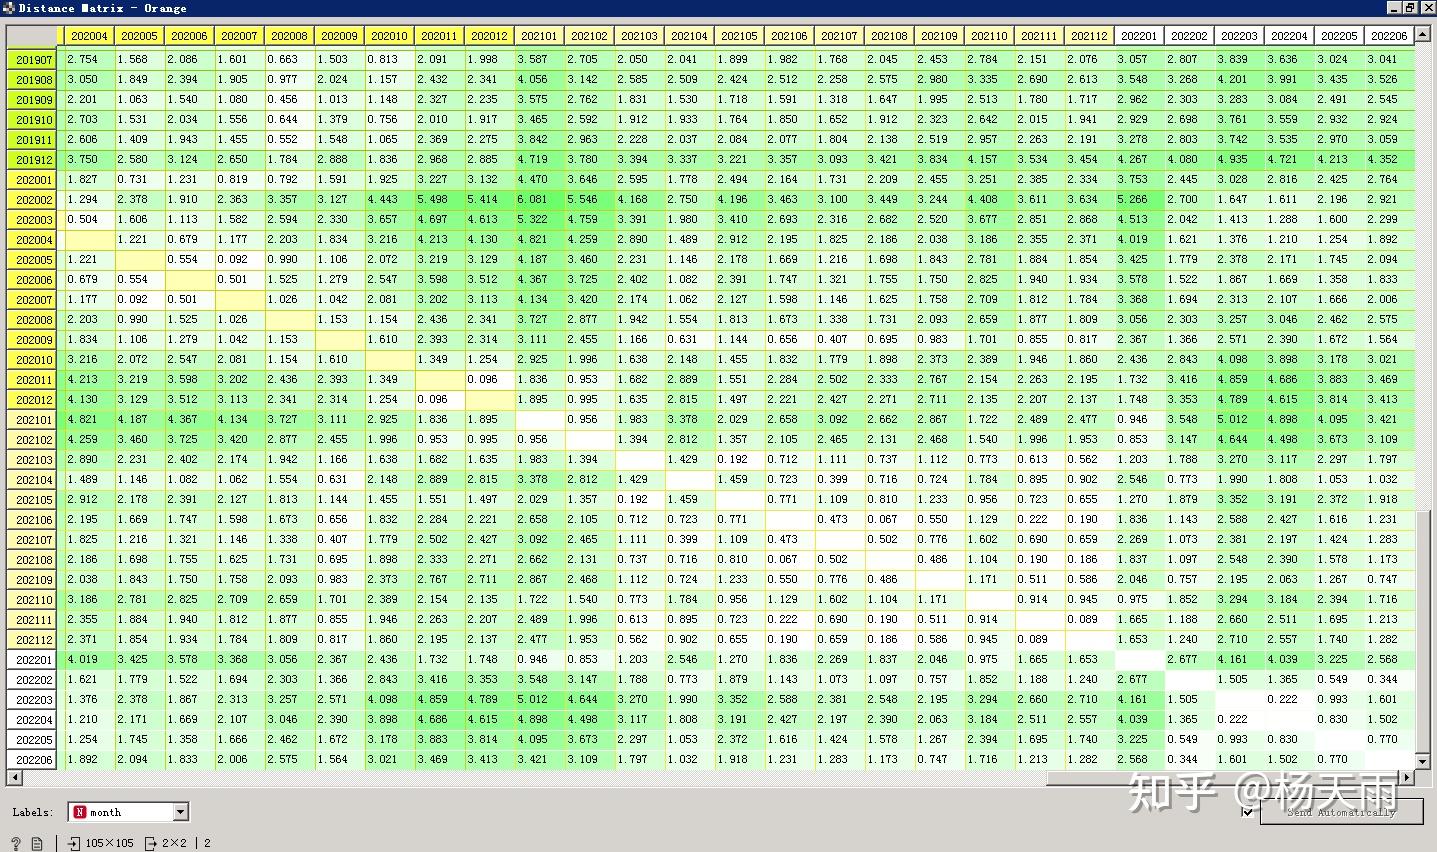
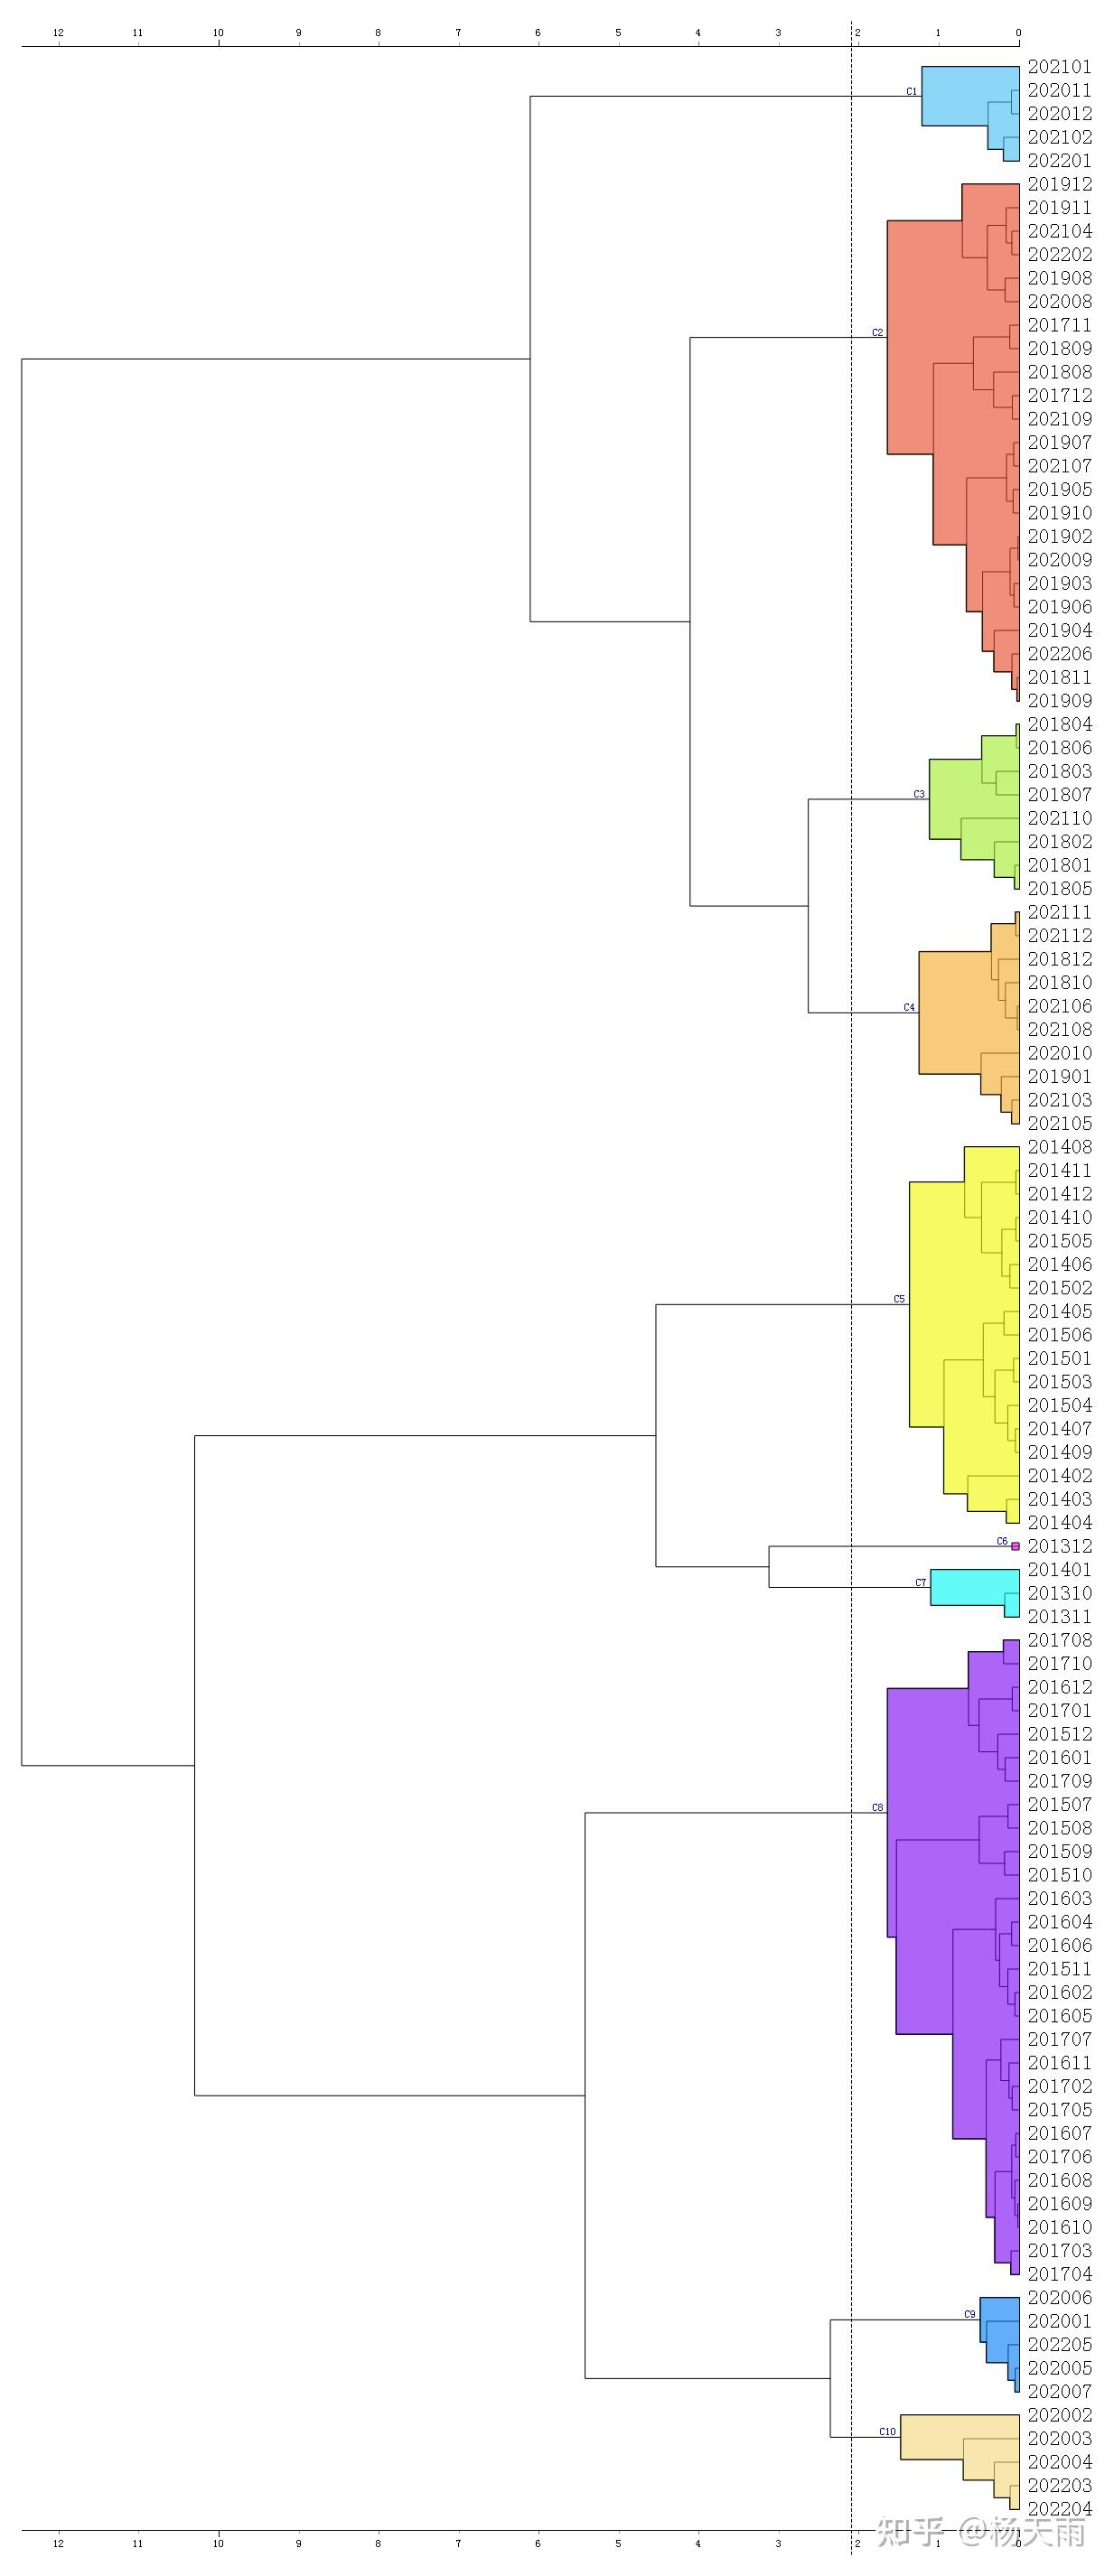
引入贡献率数据到数据挖掘软件,得到基于贡献率距离矩阵的月聚类,比如疫情爆发月份、疫情反复月份为一个类,购物中心不同运营时期划分为不同的聚类。
层次聚类,聚类技术可用于广泛的数据场景,用于发现贡献率和赚钱指数相似的月份。引入销售贡献率和租金贡献率2个变量聚类,分得18个聚类。
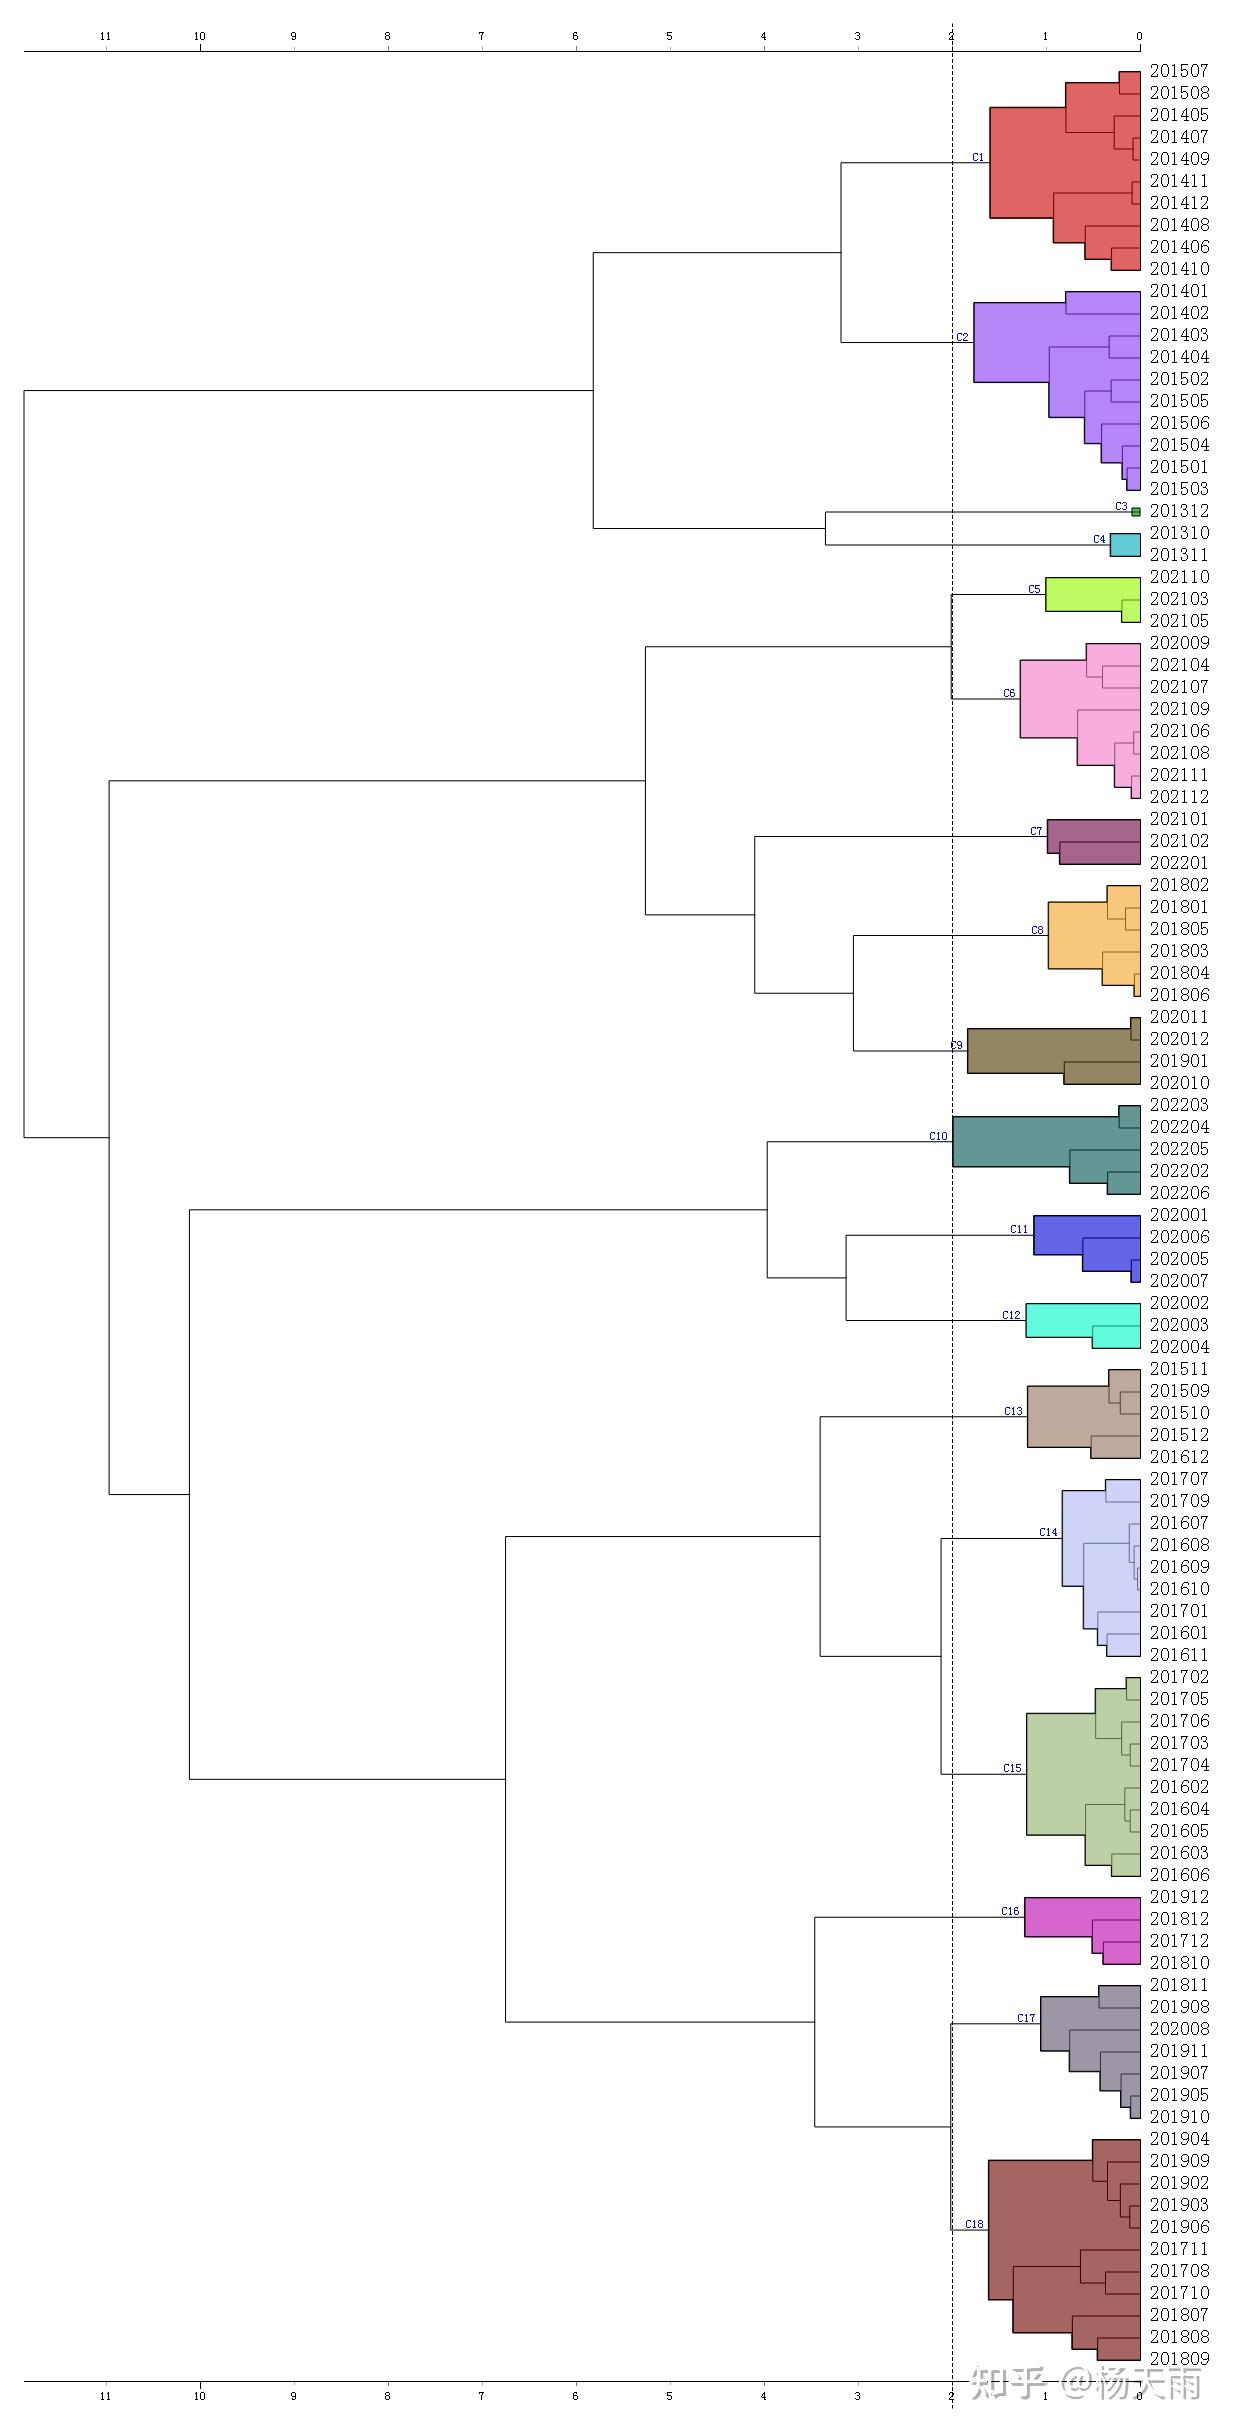
引入2个贡献率和赚钱指数,缩小到10个聚类。如疫情爆发和疫情的反复月份及疫情爆发不断反复后经济恢复月份归类为同一个类,2020年2月影响程度大于3月大于4月,2022年3月影响程度大于4月。mall在不同运营时期以2018年前后划分为不同的聚类。2022年6月同2018月11月和2019年9月相似,但表现比这两个月差。
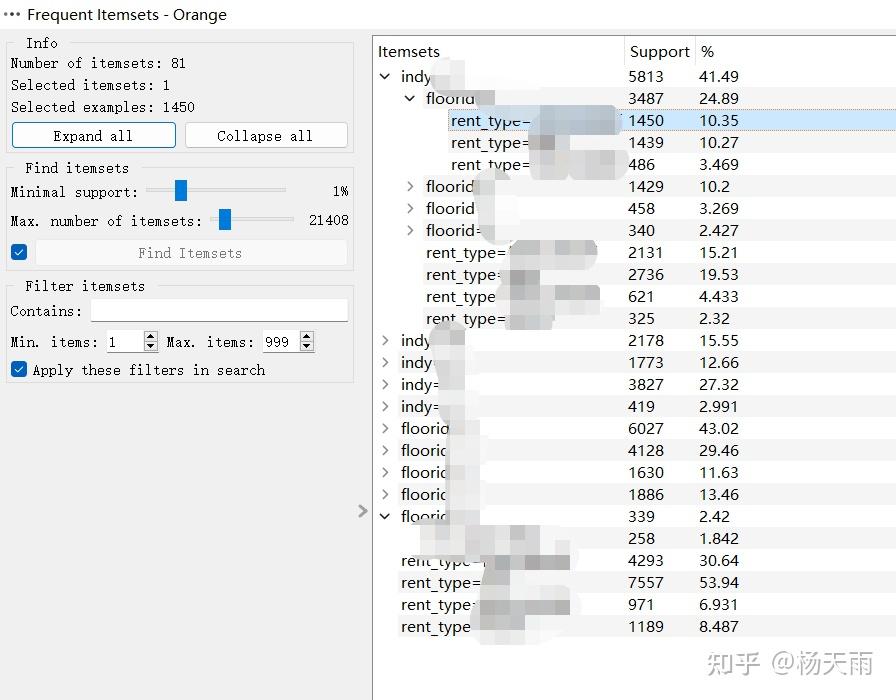
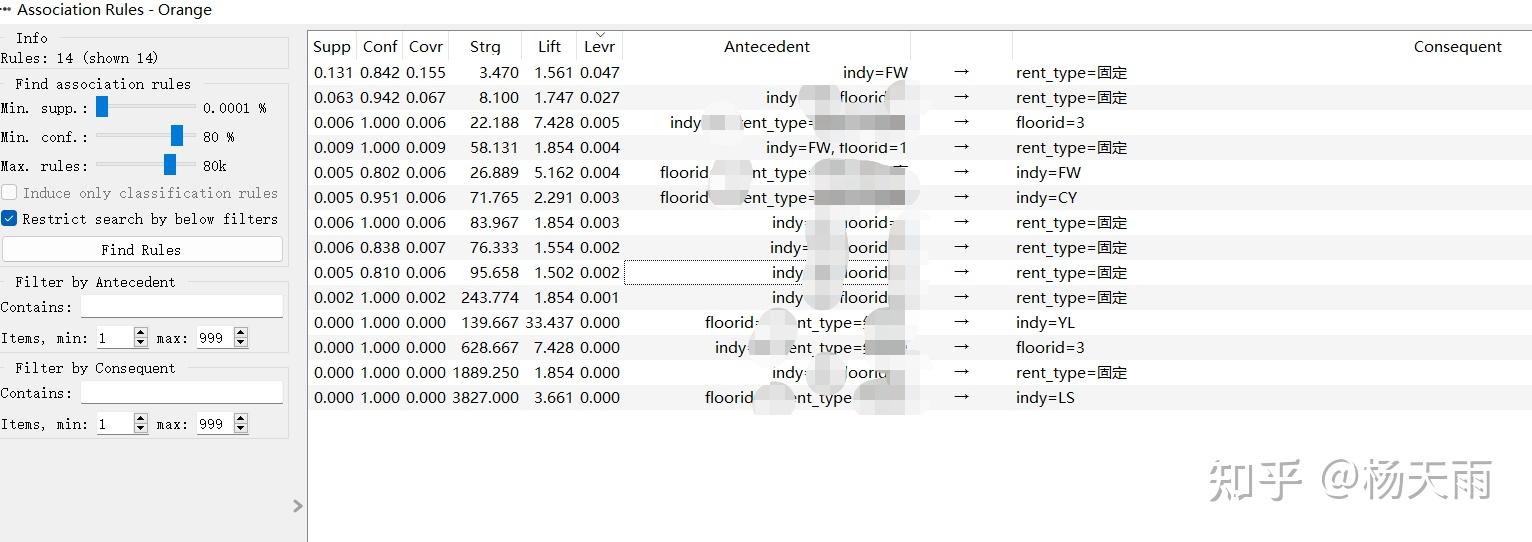
频繁模式和关联规则都不适合商业租赁数据挖掘。
如果在mall当中某种模式频繁出现,比如某类业态在某个楼层以某种收租方式长期存在,只能说明楼层的业态结构稳定,或者说某类店在mall当中在某个楼层以某种租金模式长期经营,不代表其他含义。
频繁出现的租赁模式是平庸无差异性缺乏无弹性的。
算法上前驱和后继的支持度和置信度,大体了解算法,可用市面上的数据挖掘程序。e.g.服务业以固定租金模式频繁出现,只能说明服务业某几个商户在mall的某个楼层里长期经营,没有太大变化。
摸索套用现代投资组合理论框架引入月盈亏平衡或者月租金贡献率到业态和收租方式分类方差协方差,得到的配置比例基于均值方差效用最优,这种最优就是哪类业态+收租方式的均值和稳定性最优配比,但缺乏可操作性。
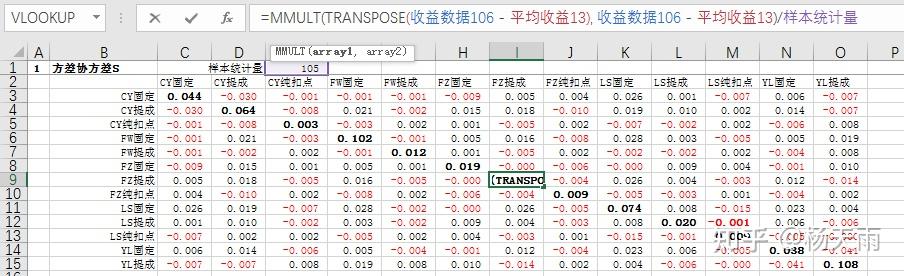
超配业绩好且稳定的模式,“做空”业绩差不稳定的模式。在现实mall运营里,你根本无法实现投资世界里的资产配置。mall的铺位配置思路和投资配置不一样,仅当参考。
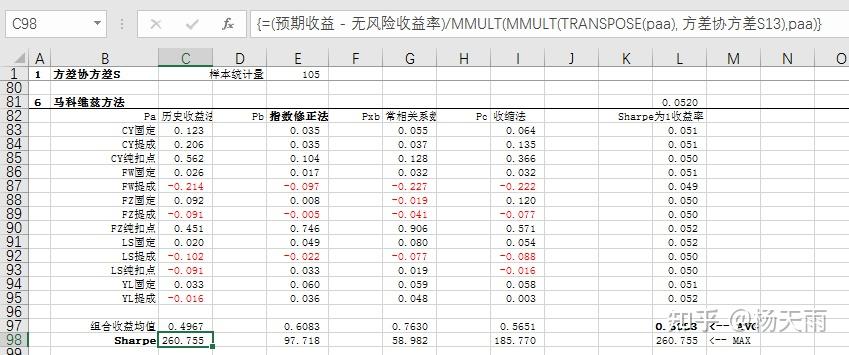
即便在投资当中使用马科维茨的均值方差方法,以历史收益率为基础的方差协方差矩阵是历史走势堆砌出来的缺乏前瞻性灵活性方差协方差矩阵,实质上没什么用处,仅在数学上有用。
组合的包络线围绕各资产风险和收益(标准差和均值),貌似科学完美,实际上没用,因为数据是历史数据。
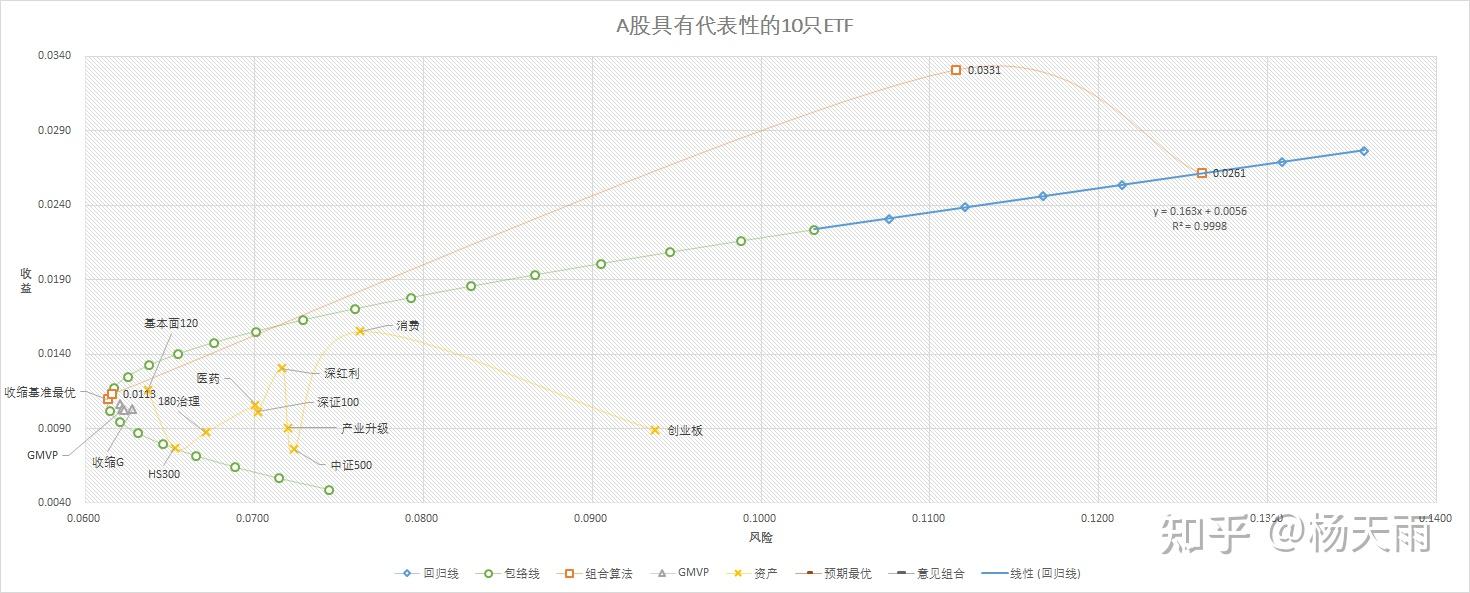
mall铺位资源配置有没有最优模式,就像官媒常说的“求最大公约数,画最大同心圆”,是目标理想,也是孜孜以求。
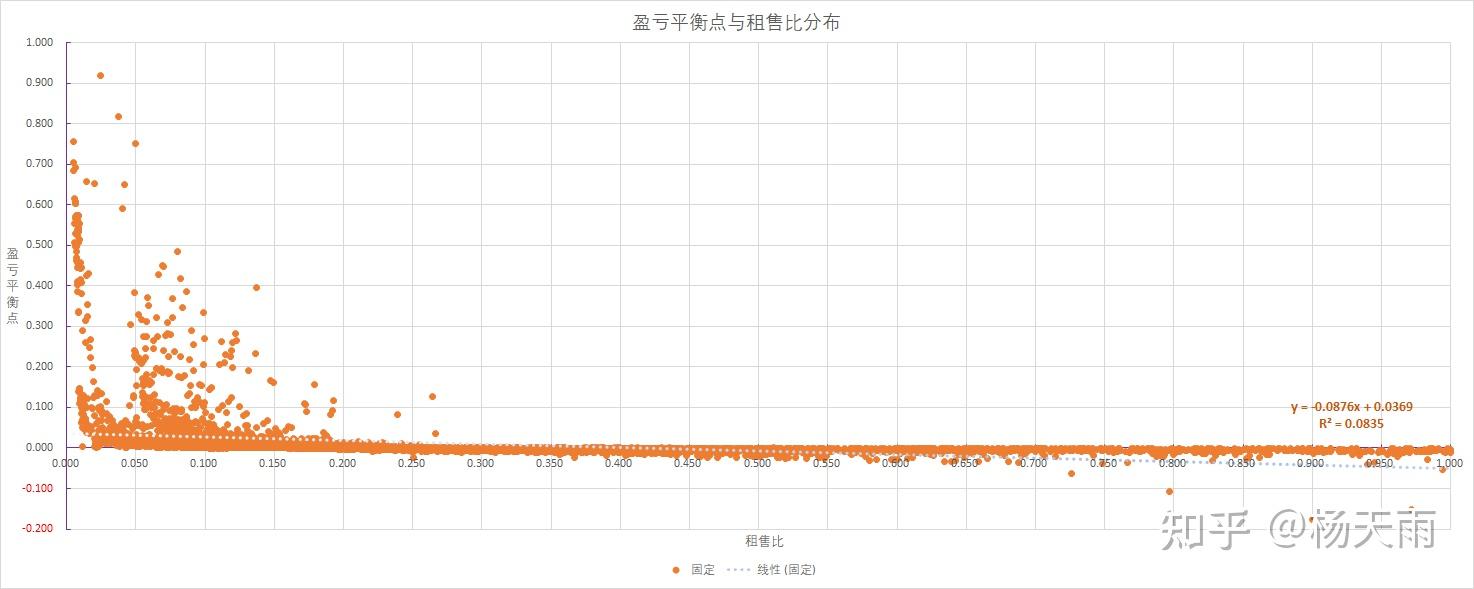
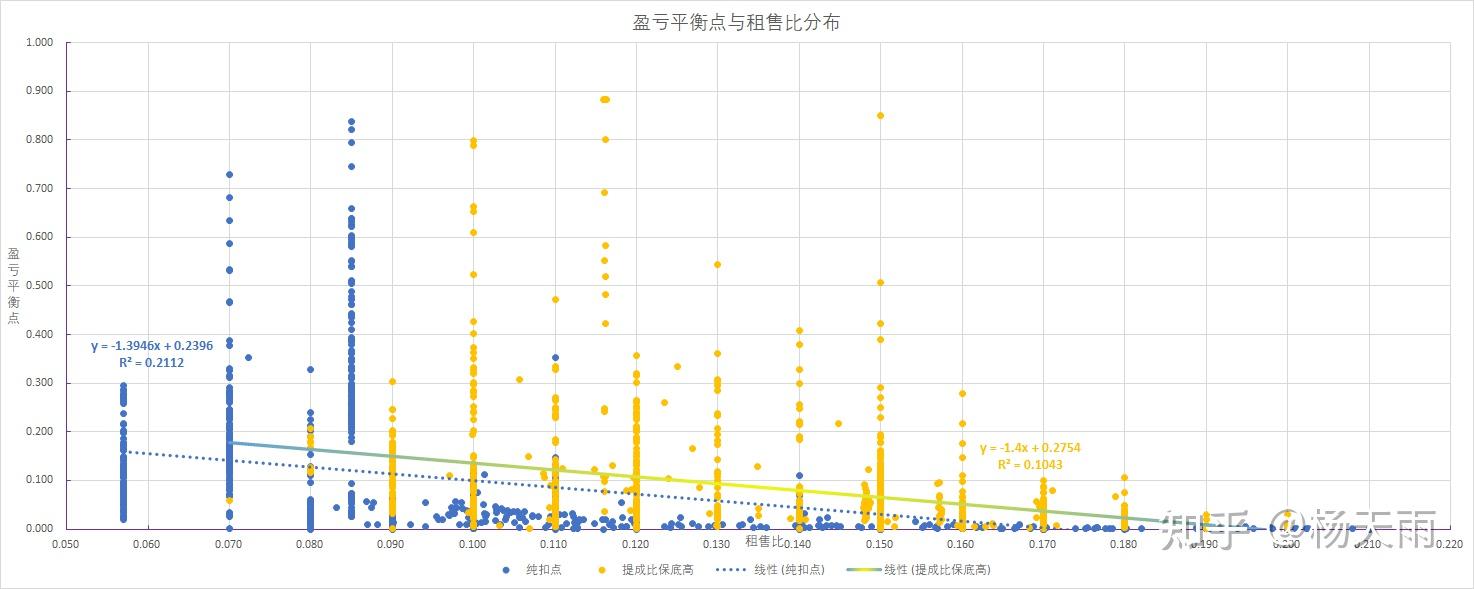
选取收租方式分类的月租售比和盈亏平衡点散点图分布,得4类分布。观察回归方程,盈亏平衡点与租售比低拟合,铺面租金不能解释商户亏损,应当销售业绩下滑归因,而最终租金确实是压死商户的最后一根稻草。
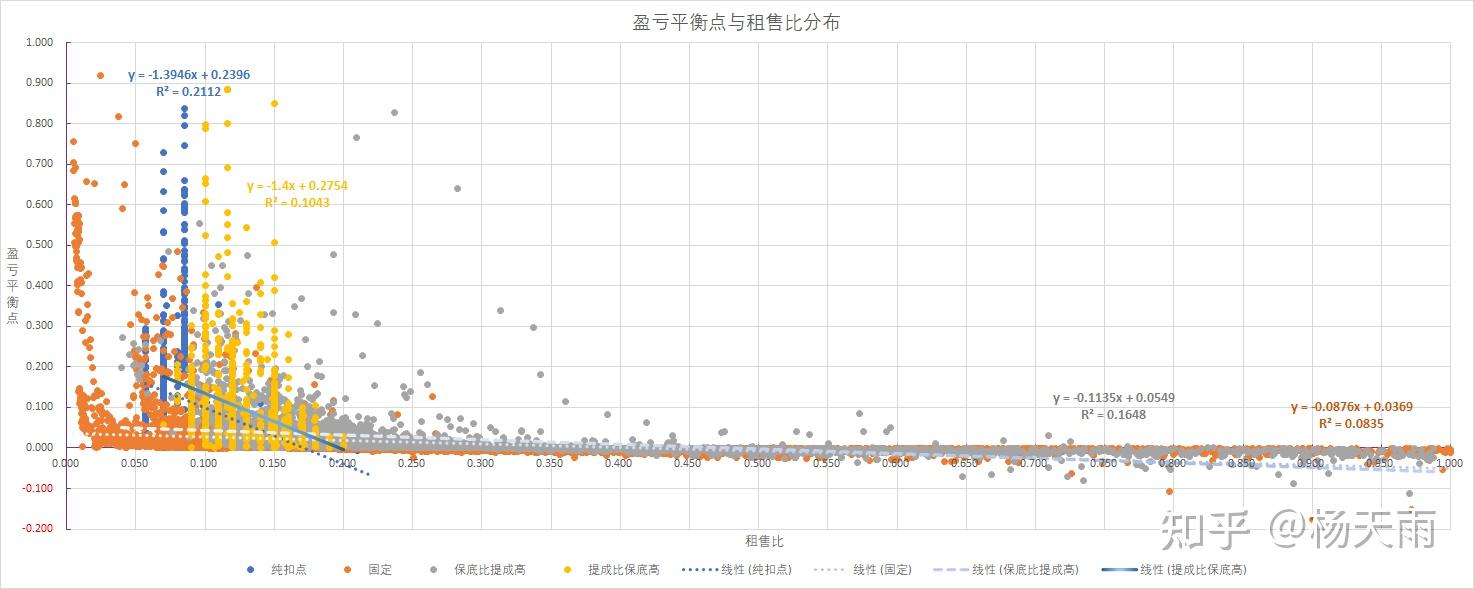
商场出于管理成本考虑,未统一收银,由商户自行呈报销售业绩,固定租金收租商户有动机填报有保留的销售业绩,会造成铺面坪效长期失真,租金定价不合理。比如退租算法得出的长期亏钱还在经营的商户。在租约早期填报真实销售,随着租金递增,倾向于填报虚假销售推高租售比,造成表面上的亏钱现象。
保底+提成销售业绩下滑时候的分布与固定租金分布相似,不同之处在租售比的起点。
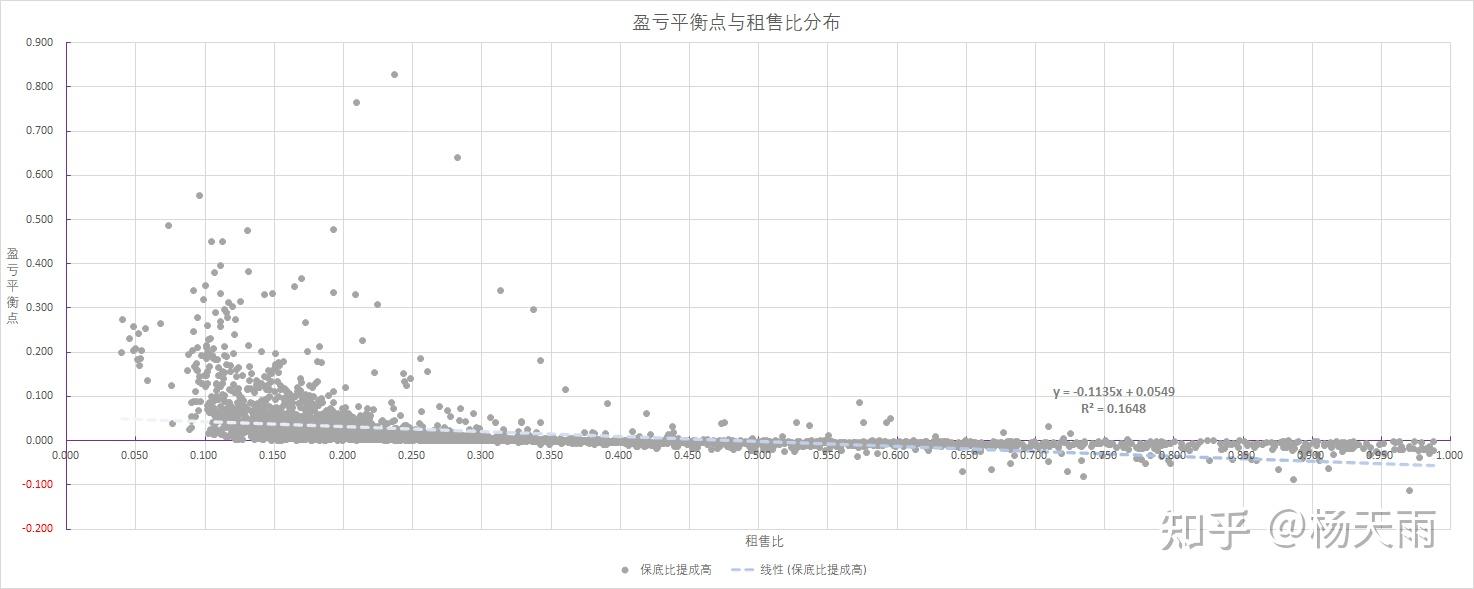
保底+提成租金在销售业绩好的时候,此类租金方式是纯扣点租金的变体,二者线性回归线是平行线。商户盈亏平衡点函数是垂直线,x=纯扣点或者租售比,这种租金模式对商户最有利,其变体对商场有利。
后续更新https://zhuanlan.zhihu.com/p/542720979
今早,微信上看到《底层逻辑》作者刘润老师的视频——《为什么太二酸菜鱼只有4人座》,他说:
“餐厅的底层逻辑是什么?是坪效,它等于营业额除以营业面积......门店要想盈利,让要让每平方米的坪效至少大于租金,提高坪效就是经营餐厅的最底层逻辑......太二酸菜鱼4人座比6-8人聊天座更容易提高翻台率,从而提高坪效和营业额......肯德基外卖也是.......”
餐饮,我是不懂的,刘老师说的对不对?我也不知道。不过,刘老师的推论到是引起了我的思考:平效是服装品牌的底层逻辑吗?
一、平效是服饰品牌的底层逻辑?
服饰品牌平效最高的是lululemon,近20年都在10万元以上(1500-2000美元/平方英尺),世界品牌零售中排第3,仅次于苹果和蒂芙尼。
lululemon几乎全直营,店均面积250-300m2,单店业绩3000-3900万,平效10-14.5万元(汇率按1美元=6.7元换算),如图:
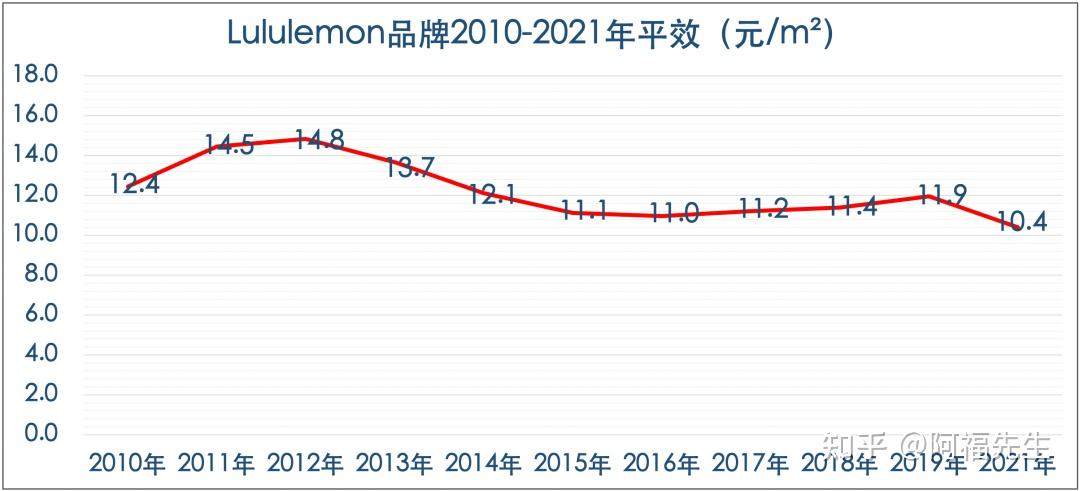
值得注意的是,lululemon的首店于1999年3月开出,2002年的平效就达到10万元以上,是其他服饰品牌的2-3倍。
2008年美国次贷危机期间,零售业受到冲击,lululemon美国的平效仍然还有7.2万+(1000美元/平方英尺),lululemon加拿大的平效则高达21万+(3000美元/平方英尺)。
那么问题来了:平效,到底是因还是果?
如果平效是因,那就是10万的平效让300m2店铺销售3000万,如果是这样,是否意味lululemon开一家600m2店铺就会有6000万销售?开一家1000m2店铺就能卖1个亿?
所以平效是果,是3000万业绩除以300m2面积的结果。面积增加或减少30m2(10%),不一定会影响业绩,但一定会导致平效波动。
问题又来了:平效波动的什么原因导致的呢?
梳理完lululemon的时间线,我找到了lululemon平效波动的内在原因,先看图:
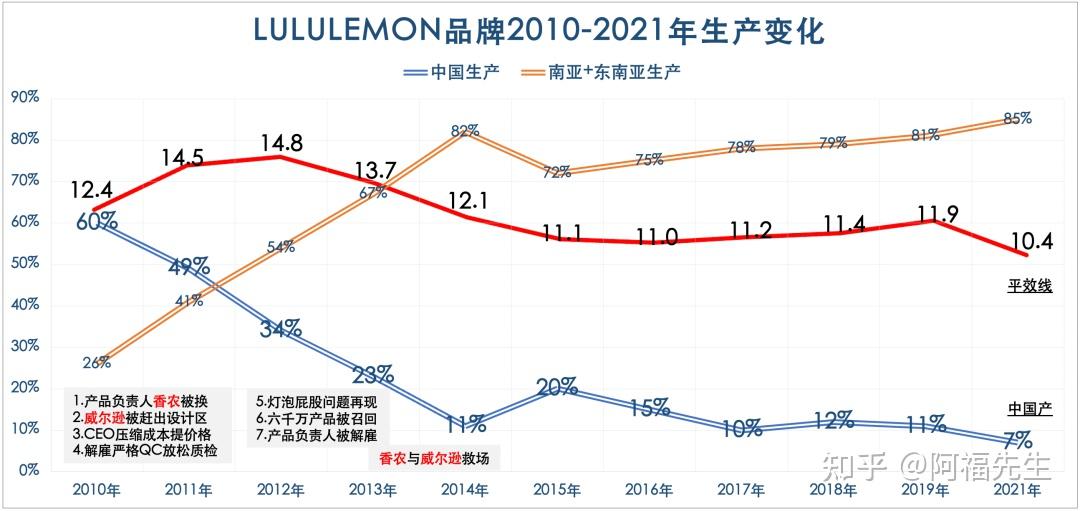
原因一:中国生产大幅下降——CEO克莉丝汀将中国供应商订单从60%砍到11%,转到“质量你懂”的越南和柬埔寨等国生产。lululemon平效变化,与一年后的中国产量变化同步。
原因二:CEO降低产品质量——CEO为了做高股价抬高自己的期权价值,不惜降低产品质量来提高公司利润,导致“灯泡屁股”问题再现。殊不知,创始人威尔逊正是靠着解决“灯泡屁股”和“骆驼趾”等问题,才让瑜伽裤畅销的。
我在lululemon——1.瑜伽品牌如何诞生一文中说过,威尔逊解决了皮疹、灯泡屁股、骆驼趾、汗湿粘身、缩水率、露股沟、腿长腿短等问题,才有了平效世界第3的lululemon。
大胆假设一下:假如顾客买到的lululemon瑜伽裤出现骆驼趾、严重缩水、屁股像灯泡一样能看清内裤轮廓,你认为他还能维持10万的平效吗?

看到这里,一定有人恍然大悟说:原来服饰品牌的底层逻辑是产品啊。
问题又来了:产品是服饰品牌的底层逻辑吗?为什么迪桑娜DISSONA(包)和可至COZY(鞋)等品牌没感受到呢?
二、产品是服饰品牌的底层逻辑?
可至COZY品牌是CHANEL、BURBERRY、LV、GUCCI等奢侈品牌的供应商,你要说他们的产品不好,LV都不答应。可至COZY这一类供应商出身的品牌,产品自然是没得说。
某些品牌总想让我去生产线和研发车间看一看,他们觉得“你没亲眼所见,就不知道我们的产品有多好”。我都拒绝了,因为不用看。
产品只能算品牌底层逻辑的一部分,不是全部。

威尔逊1998年创业的时候,瑜伽老师穿的舞蹈裤售价40多美元,lululemon的瑜伽裤成本价40美元(同行的4-5倍),假设威尔逊这样做:
1)80美元批发,批发商卖160美元;
2)商场开自营,自己卖160美元;
请问lululemon能有今天吗?
当然没有啊,迪桑娜和可至不就是这么干的吗?结果怎样呢?我在ESPRIT——王者如何从巅峰跌落一文中说过,一般平效2万以上就有盈利。可至的平效肯定在1万以下。
威尔逊将定成本压缩到30美元,零售价90-100美元不批发,还发动瑜伽老师到店铺做瑜伽,带动瑜伽裤的大卖,在2002年就将平效整到了10万+。

所以,服饰品牌的底层逻辑是什么呢?
1)解决客户群需求的好产品;
2)客户群能承受的合理价格;
3)用合理价格将好产品卖爆。
毛利率50%以上的价格才是合理价格。提取关键词就成了产品+价格+营销,这就又有点老生常谈了,看起来毫无新意。
我来总结一个有点新意的说法——基层路线,从服装链条的下游(顾客需求)往上游(设计和生产)撸,逻辑自下而上,与自上而下的「上层路线」完全背离。基层路线就是服饰品牌的底层逻辑,好产品的上层路线品牌依然做不好。
好了,今早的思考闭环了,平效不是服饰品牌的底层逻辑,那么餐饮呢?
大胆假设一下:如果太二把酸菜和鱼换了,高峰时段用餐人数仅半场,4人座还能提高坪效吗?
同类文章排行
- 精雕机的错位原因有那些?
- 数控精雕机主轴加工后的保养方法
- cnc高光机在使用时候需要注意什么
- 精雕机不归零加工完闭后不回工作原点?
- 一个高端数控系统对精雕机的重要性
- 主轴达不到指定转速?
- 高光机主轴轴承容易坏的原因
- 手机边框高光机的特点
- 五金高光机的质量判断的四大标准
- 开机无反应,机床没电,手柄无反应,不显示?